Candlestick charts were invented by Japanese rice traders in the 18th century and have been used to track price action ever since. When Steve Nison introduced them to Western traders in his 1991 book Japanese Candlestick Charting Techniques, they quickly became the dominant chart type used by technical analysts worldwide. Today, candlestick patterns appear on every major trading platform and are read by retail traders, institutional desks, and algorithmic systems alike — which is precisely why they retain their predictive power. The more traders who recognize and act on the same pattern, the more reliably that pattern produces the expected outcome.
This guide covers the most important candlestick patterns — from the basic anatomy of a single candle to three-candle reversal formations — and explains how to use volume, support and resistance, and trend context to confirm each pattern before entering a trade.
The Anatomy of a Candlestick
Each candlestick represents price action over a defined time period — one minute, one hour, one day, or one week, depending on your chart setting. The candlestick has four data points: the open, high, low, and close prices during that period.
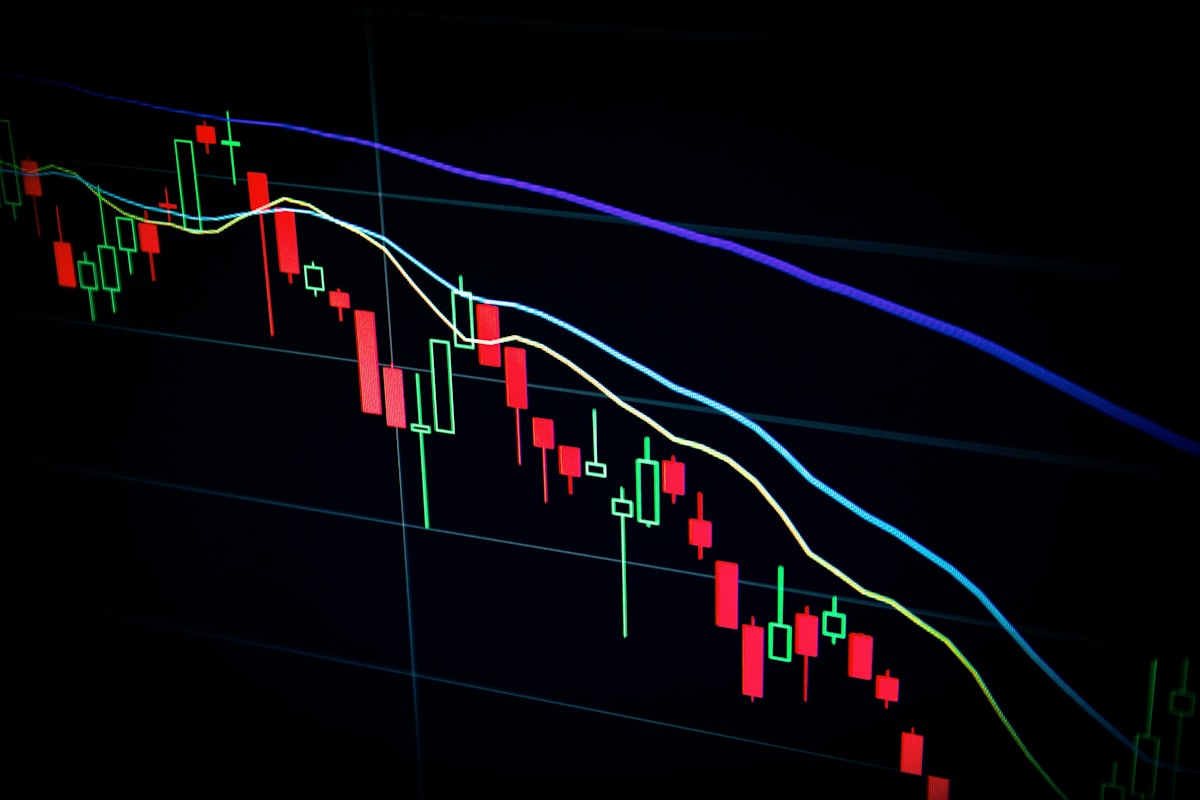
The body of the candle is the thick rectangular portion representing the range between the open and close prices. A bullish candle (usually shown in green or white) closes higher than it opened — buyers dominated that period. A bearish candle (usually shown in red or black) closes lower than it opened — sellers dominated.
The wicks (also called shadows or tails) are the thin lines extending above and below the body. The upper wick shows how high price traveled above the body during the period before sellers pushed it back down. The lower wick shows how low price fell before buyers pushed it back up. Long wicks indicate rejection of extremes — a long upper wick on a bearish candle shows buyers tried to push higher but were overwhelmed by sellers. A long lower wick on a bullish candle shows sellers tried to push lower but were absorbed by buyers.
The relative length of the body versus the wicks tells you the conviction behind the move. A large body with tiny wicks shows dominance by one side. Small bodies with large wicks show indecision and potential reversal.
Single-Candle Reversal Patterns
Single-candle patterns are the most immediately actionable signals. They occur at support or resistance levels and indicate a potential shift in the balance between buyers and sellers.
The Hammer forms at the bottom of a downtrend and signals potential bullish reversal. It has a small body near the top of the candle, a lower wick at least twice the length of the body, and little to no upper wick. The long lower wick shows sellers drove price sharply lower during the session, but buyers stepped in aggressively and pushed price all the way back up near the open. A bullish engulfing candle the following session confirms the reversal. The hammer only carries significance when it forms at a clear support level — a random hammer in the middle of a range is meaningless.
The Shooting Star is the hammer's bearish counterpart. It forms at the top of an uptrend with a small body near the bottom of the candle and a long upper wick at least twice the body length. Buyers pushed price sharply higher during the session, but sellers overwhelmed them and pushed price back down near the open — indicating buying exhaustion and potential reversal. A bearish candle the following session confirms the signal.
The Doji forms when the open and close prices are virtually equal, resulting in a near-nonexistent body with visible wicks. The doji represents perfect indecision — neither buyers nor sellers dominated the period. On its own a doji is neutral, but in context it is powerful. A doji at the top of a strong uptrend suggests the trend is losing momentum; a doji at the bottom of a downtrend suggests sellers are exhausted. The doji must be confirmed by the following candle's direction.
The Spinning Top is similar to the doji but has a small (not zero) body with wicks of roughly equal length on both sides. Like the doji, it signals indecision and is most meaningful at trend extremes or at key support and resistance levels.
Two-Candle Reversal Patterns
Two-candle patterns provide stronger signals than single-candle patterns because they show a clear shift in control from one session to the next.
The Bullish Engulfing Pattern forms at the end of a downtrend when a large bullish candle completely engulfs the body of the preceding bearish candle. The second candle's body must open below the first candle's close and close above the first candle's open. This dramatic shift shows buyers overwhelmed sellers decisively in a single session. Volume confirmation is critical — the bullish engulfing day should have volume noticeably higher than the prior bearish day. Bullish engulfing patterns at major support levels with above-average volume are among the most reliable reversal signals in all of technical analysis.
The Bearish Engulfing Pattern is the bearish counterpart — a large bearish candle that completely engulfs the body of the preceding bullish candle at the top of an uptrend. Sellers overwhelmed buyers dramatically in a single session, signaling that the uptrend may be exhausted. Look for this pattern at prior resistance levels or at all-time highs after a prolonged rally.
The Piercing Line is a bullish two-candle pattern similar to the bullish engulfing but less extreme. The second candle opens below the prior candle's low and closes above the midpoint of the prior candle's body — but not above its open. It signals that buyers are beginning to overwhelm sellers but have not yet fully taken control. Treat it as a cautious bullish signal requiring confirmation from the next session.
The Dark Cloud Cover is the bearish counterpart of the piercing line — a bearish candle that opens above the prior bullish candle's high and closes below the midpoint of the prior candle's body. It signals that sellers are beginning to overwhelm buyers at resistance. Like the piercing line, it requires confirmation.
Three-Candle Reversal Patterns
Three-candle patterns provide the strongest reversal signals because they show a multi-session shift in trend momentum. They are rarer than single or two-candle patterns, but their reliability is correspondingly higher.
The Morning Star is one of the most bullish reversal patterns in candlestick analysis. It forms at the bottom of a downtrend across three consecutive sessions. Session one is a large bearish candle continuing the downtrend. Session two is a small-bodied candle (or doji) that gaps down from the first — this is the "star," representing indecision as sellers begin to lose control. Session three is a large bullish candle that gaps up from the star and closes above the midpoint of session one's body, confirming that buyers have taken control. The Morning Star is most powerful at a major support level with above-average volume on session three.
The Evening Star is the bearish counterpart to the Morning Star, forming at the top of an uptrend. Session one is a large bullish candle. Session two is a small-bodied star that gaps up — sellers begin to match buyers. Session three is a large bearish candle that closes below the midpoint of session one's body. High volume on session three confirms the reversal signal.
Three White Soldiers is a powerful bullish continuation or reversal pattern consisting of three consecutive large bullish candles, each opening within the prior candle's body and closing progressively higher. Volume should remain strong across all three sessions. Three White Soldiers after a downtrend or at a major support level signals a decisive shift in control to buyers — but when it appears at the top of a prolonged uptrend, it can signal climactic buying exhaustion rather than continuation.
Three Black Crows is the bearish mirror image — three consecutive large bearish candles each closing progressively lower. This pattern at the peak of an uptrend or at resistance is a strong signal of trend reversal, particularly when accompanied by increasing volume across the three sessions.
How to Confirm Candlestick Patterns
No candlestick pattern should be traded in isolation. Context and confirmation dramatically improve the reliability of any pattern.
Location matters most. A hammer at a major support level that has held for months is a high-probability reversal signal. A hammer in the middle of a range with no technical significance is noise. Always ask: why would this pattern produce a reversal here? The answer should be a clear technical reason — support, resistance, prior breakout level, or a key moving average.
Volume confirms conviction. Bullish reversal candles at support should have above-average volume — buyers stepping in aggressively. Bearish reversal candles at resistance should also have elevated volume. If the reversal candle forms on below-average volume, treat it with skepticism and wait for further confirmation.
Wait for the confirming candle. Most professionals do not trade the pattern on the same candle it forms — they wait for the next candle to confirm. If a hammer forms, they wait for the next session to produce a bullish candle before entering. This costs a small amount of potential profit but significantly reduces the number of failed pattern trades.
The Bottom Line
Candlestick patterns are not magic — they are visual representations of the ongoing battle between buyers and sellers, and learning to read them fluently gives you a direct window into market psychology at turning points. The patterns covered in this guide — hammers, shooting stars, bullish and bearish engulfing candles, morning and evening stars — are the foundation of candlestick analysis used by professional traders worldwide.
Practice identifying these patterns on historical charts before applying them to live trading. Focus on patterns at key support and resistance levels with volume confirmation. Start with just two or three patterns rather than trying to memorize every variation — mastery of a few reliable patterns is worth far more than superficial familiarity with dozens.
Official Resources
For further research, the following official sources provide authoritative information on the topics covered in this article.
- CME Group Education — Free candlestick and technical analysis education resources
- FINRA Investor Education — FINRA guidance on technical trading strategies and risks
- S&P Global Market Intelligence — Official S&P index data and market intelligence
Sources & Trading Risk Note
This article is for educational purposes only and is not financial advice. Trading involves risk, leveraged products can amplify losses, and market rules or evaluation terms can change. Verify current contract specs, exchange rules, and firm-specific terms before trading.


💬 Comments (0)
No comments yet. Be the first to share your thoughts!