Technical analysis is the study of price charts to predict future price movements. While fundamental analysis asks "what should I buy?", technical analysis answers "when should I buy it?" Every serious trader needs both — but technical analysis is your edge for timing entries and exits.
The Three Core Principles
Technical analysis is built on three assumptions:
- Price discounts everything. All known information — earnings, news, sentiment — is already reflected in the stock price. You don't need to know WHY a stock is moving, only THAT it's moving.
- Prices move in trends. Once a trend starts, it's more likely to continue than reverse. Your job is to identify the trend and trade with it.
- History repeats itself. Patterns that worked in the past tend to work again because human psychology doesn't change. Fear and greed create the same chart patterns decade after decade.
Chart Types You Need to Know
Line Chart: Connects closing prices with a simple line. Good for seeing the big picture trend, but hides important intraday information.
Bar Chart (OHLC): Shows Open, High, Low, and Close for each time period. More detailed than line charts but harder to read quickly.
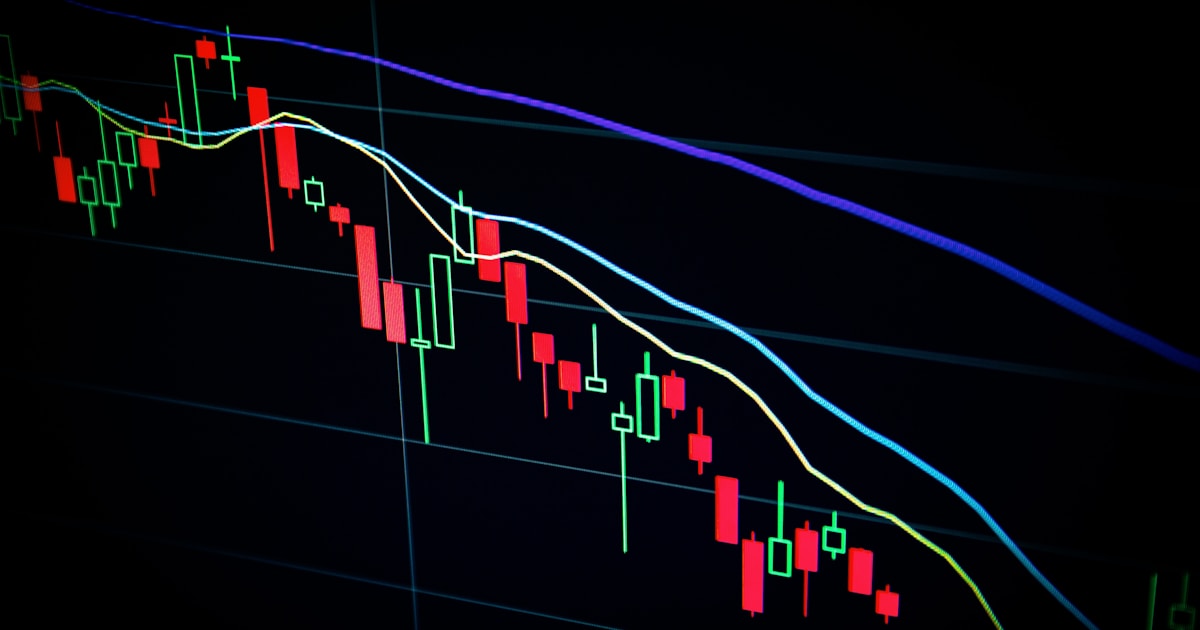
Candlestick Chart: The gold standard for traders. Each "candle" shows the open, high, low, and close with a colored body:
- Green/White candle: Close was higher than open (bullish — price went up)
- Red/Black candle: Close was lower than open (bearish — price went down)
- Wicks/Shadows: The thin lines above and below show the high and low of the period
- Body size: Large bodies = strong conviction. Small bodies = indecision.
Understanding Trends
Every stock is in one of three states:
- Uptrend: Higher highs and higher lows. Buy dips to support levels.
- Downtrend: Lower highs and lower lows. Sell rallies to resistance levels or stay away.
- Sideways (Range): Price bouncing between support and resistance. Trade the range or wait for a breakout.
The most important rule in trading: trade WITH the trend, not against it. The saying "the trend is your friend" exists for a reason. Fighting the trend is how most beginners blow their accounts.
Support and Resistance
These are the most fundamental concepts in technical analysis:
- Support: A price level where buyers consistently step in. Think of it as a "floor" — the price bounces off it. The more times a support level holds, the stronger it becomes.
- Resistance: A price level where sellers consistently appear. Think of it as a "ceiling" — the price gets rejected here. Once resistance is broken, it often becomes new support.
How to identify them:
- Look for price levels where the stock has bounced or reversed multiple times
- Round numbers ($50, $100, $200) often act as psychological support/resistance
- Previous highs become resistance; previous lows become support
- High-volume price levels are stronger than low-volume ones
Essential Indicators for Beginners
Indicators are mathematical calculations plotted on charts. Start with these three:
1. Moving Averages (MA)
- Smooths price data to show the trend direction
- 50-day MA: Medium-term trend. Price above = bullish; below = bearish.
- 200-day MA: Long-term trend. Institutional investors watch this closely.
- Golden Cross: 50-day crosses above 200-day = strong bullish signal
- Death Cross: 50-day crosses below 200-day = strong bearish signal
2. Volume
- Volume confirms price moves. A breakout on high volume is more likely to hold than one on low volume.
- Rising price + rising volume = healthy trend
- Rising price + declining volume = weakening trend (potential reversal coming)
- Volume spikes often mark trend reversals or the start of new trends
3. RSI (Relative Strength Index)
- Oscillates between 0 and 100
- Above 70: Overbought — stock may be due for a pullback
- Below 30: Oversold — stock may be due for a bounce
- Best used in combination with support/resistance, not as a standalone signal
- Divergence: When RSI makes a lower high while price makes a higher high = bearish warning sign
Timeframes Matter
The same stock can look bullish on one timeframe and bearish on another:
- 1-minute, 5-minute: Day trading. Very noisy, requires fast decisions.
- 15-minute, 1-hour: Day trading and swing trading. Smoother than lower timeframes.
- Daily: Swing trading. The most commonly used timeframe for individual traders.
- Weekly, Monthly: Position trading and investing. Shows the big picture.
Pro tip: Always check the higher timeframe first. If the weekly chart is in a downtrend, buying on a daily chart pullback is risky — you're fighting the bigger trend.
Common Beginner Mistakes with Charts
- Using too many indicators: 2-3 indicators is enough. More creates "analysis paralysis" and contradictory signals.
- Ignoring volume: Price without volume context is incomplete information.
- Looking for perfection: No pattern works 100% of the time. Technical analysis is about probabilities, not certainties.
- Forcing trades: If the chart isn't clear, don't trade. The best traders are patient — they wait for high-probability setups.
- Ignoring the bigger trend: A bullish pattern in a bearish market often fails. Always check the higher timeframe.
Sources & Trading Risk Note
This article is for educational purposes only and is not financial advice. Trading involves risk, leveraged products can amplify losses, and market rules or evaluation terms can change. Verify current contract specs, exchange rules, and firm-specific terms before trading.
💬 Comments (0)
No comments yet. Be the first to share your thoughts!